Solar planning for Mac · Apple Silicon · macOS 14+

Know what your roof will make — shade and all.

Model your house, its trees and its neighbours in 3D. SolarSolution Studio simulates every hour of the year and turns it into production, shade loss, savings and payback you can check — for any site on Earth.
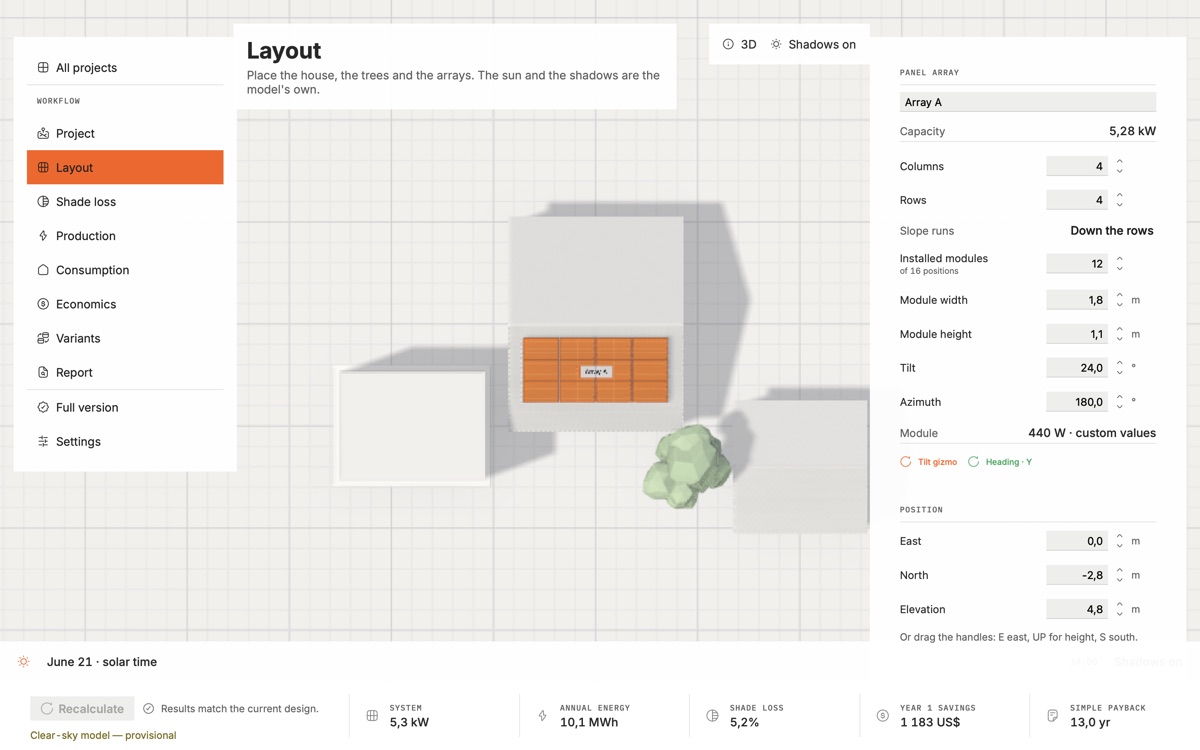
SolarSolution Studio’s Layout view: a house with a twelve-panel array on its roof, a tree and two neighbouring buildings casting shadows, with the array’s settings on the right and the year’s results along the bottom.
8,760
hours simulated for every array, every year
Worldwide
weather from PVGIS and NASA POWER, or your own file
No account
projects and calculations stay on your Mac
Free
no trial, no subscription, no ads

01 · What it answers

The questions you have before you buy panels

Each one is answered from your own site: your roof, your trees, your weather, your tariff.

01

How much will my roof produce?

Every array is simulated hour by hour for a full year: the sun’s path, direct and diffuse light on the tilted modules, heat and inverter losses.

02

What does the shade cost me?

Trees, chimneys and the neighbour’s house are traced against the sun and the sky. See the loss by month and by hour, and which object causes it.

03

Where should the panels go?

Place panel arrays on flat, mono-pitch, gable or hip roofs. Change tilt, heading and module count and watch the shadows move.

04

Will it pay for itself?

Enter your tariff, export terms and the system price. Get bill savings, payback, NPV and a year-by-year cash flow in your currency.

05

Which design is better?

Save variants of the same house and compare size, production, shade loss, savings and payback side by side.

06

What do I take to the installer?

A multi-page PDF with the site, production, shade loss, economics and every assumption behind them.

02 · How it works

From an address to a year of numbers in three steps

  1. Step 01

    Find the site

    Search an address anywhere or paste coordinates. The weather year for that spot loads by itself — no account, no setup.

  2. Step 02

    Build the scene

    Add the house and its roof, the panel arrays, trees and nearby buildings. Trace over your own aerial photo when you have one.

  3. Step 03

    Read the result

    Production, shade loss, savings and payback follow every change. Save variants and export the report as a PDF.

03 · Who it’s for

One tool, two kinds of people who need honest numbers

Homeowners and DIY

Decide with your own numbers

  • Check a design before you ask for quotes.
  • Check a quote before you sign it.
  • See what the tree in the yard really costs — and whether moving the array fixes it.

Installers and small businesses

A fast second opinion

  • Shade and yield for a site in minutes, not a CAD session.
  • Unlimited projects and a clean PDF your client can read.
  • Runs offline on the Mac you already have. No seat licences.

04 · Method

An engineering model, not a rule of thumb

Published models, run for every hour of the year. What is measured and what is assumed is written down — in the app, in the report and here.

Solar position
NOAA equations, shared by the 3D view and the energy model — the sun you see is the sun that is counted
Weather
PVGIS typical year, then a NASA POWER hourly year, or your own file — the source is always named
Light on the panels
Hay–Davies–Klucher–Reindl transposition with circumsolar and horizon terms
Shading
Ray-traced direct beam and a 145-patch sky dome, per array and per hour
Module temperature
Sandia open-rack model from irradiance, air temperature and wind
Inverter
Part-load efficiency curve, clipped to the AC rating
Economics
Hourly bills on flat, time-of-use or tiered rates; payback, NPV, IRR and LCOE
Cross-check
Compared against pvlib, the open-source PV modelling library

05 · Price

Free. Try it on your own house.

Everything included

Free

On the Mac App Store · no account, no subscription, no ads

  • Unlimited projects, plus a worked example
  • The full 3D scene, shade loss, production and economics
  • Every panel array, tree and building you need
  • Up to five design variants per project, compared side by side
  • PDF report without a watermark

06 · Privacy

No account. Your projects stay on your Mac.

Calculations run locally. The app sends a site’s coordinates only to the services that need them — address search, weather and map imagery — and never your projects.

07 · FAQ

Questions people ask first

Does it work in my country?

Yes. Weather comes from PVGIS or NASA POWER for almost any point on Earth, and you can load your own hourly file. Automatic aerial imagery covers the continental US for now; elsewhere, import your own photo and trace over it.

Which Macs does it run on?

Macs with Apple Silicon (M1 or later) on macOS 14 Sonoma or newer.

Is it really free?

Yes. The whole app is free on the Mac App Store, with no in-app purchases, subscription or ads.

Is this a quote or a guarantee?

No. It is a preliminary estimate for planning and comparing designs. Real systems, prices and savings differ — talk to a qualified local installer before you buy.

Do I need exact roof measurements?

They help. Measure the house or use a plan, or import an aerial photo and trace the roof over it.

Does it model batteries?

Not yet. Version 1 models panels and inverters; battery storage is on the list.

Coming to the Mac App Store

Model your own roof — free

SolarSolution Studio is on its way to the Mac App Store. It will be free, with no account, subscription or ads.

Questions or ideas? Write to support@solar-solution.app.

Methodology

How the numbers are made

SolarSolution Studio runs the same chain for every hour of a typical year, for every panel array, and adds the arrays up. Each step is a published model.

The chain, hour by hour

  • Sun position — NOAA equations, taken at the middle of each hour and at the middle of the daylight in the sunrise and sunset hours. The 3D view uses the same sun.
  • Weather — a full year of hourly global, direct and diffuse light, air temperature and wind for the site.
  • Light on the panels — Hay–Davies–Klucher–Reindl transposition onto each array’s tilt and heading, plus light reflected from the ground.
  • Shade — the scene is ray-traced: the share of direct sun each array loses in each hour, and the part of the sky and ground its surroundings hide. Deciduous trees thin out in winter.
  • Reflection — an incidence-angle correction on direct light.
  • Module temperature — the Sandia open-rack model. Hot modules make less.
  • DC output — nameplate power × effective light × temperature factor × (1 − system losses).
  • Inverter — a part-load efficiency curve, clipped at the inverter’s AC rating.

How shade loss is measured

The year is simulated twice: with the trees, buildings and chimneys, and without them. The difference is the shade loss — by array, by month and by hour.

How the money is counted

Hourly production is set against an hourly household load and your tariff — flat, time-of-use or tiered, with net metering or a rate for exported energy. The cash flow covers the analysis period with price escalation, panel degradation, running costs and one inverter replacement.

What it is checked against

The model is cross-checked against pvlib, the open-source PV modelling library, on a reference site. The model version is printed on every report.

Data sources

Where the inputs come from

Every result carries the name of the data it was made from, into the report as well.

Weather

  • PVGIS typical meteorological year from the European Commission’s Joint Research Centre — the first choice.
  • NASA POWER hourly data for the last full year — when PVGIS has no data for the site.
  • Your own file — EPW, SAM CSV, PVGIS CSV or JSON, or the app’s template, checked before it is used.
  • When there is no weather for the site, results read No data rather than a guess, and the app shows where to download a typical year.

Location

  • Address search: Photon, built on OpenStreetMap data.
  • Map: Apple Maps.
  • Time zone: from the site’s coordinates, or entered by hand.

Aerial imagery

  • Continental US: USDA NAIP imagery through USGS, public domain.
  • Everywhere else: import your own aerial or drone photo and trace over it.

What you enter

The house, roof, arrays, trees and neighbours; household consumption; your tariff, the system price and any incentive. Defaults are shown and editable, and the report lists every input.

Limitations

What it doesn’t do

Knowing where an estimate stops is part of trusting it. Version 1 is deliberately honest about these.

  • It is not a quote. Prices, savings and payback are estimates from the numbers you enter.
  • No permits, structural or electrical design. It does not check roof loads, wiring or local codes.
  • No batteries yet.
  • Shade is linear: shaded light is lost in proportion. String layout and bypass-diode effects are not modelled.
  • Snow on the modules and spectral effects are not modelled; soiling is part of one system-loss figure.
  • Distant terrain is included only when the weather source includes it, as PVGIS does.
  • Automatic aerial imagery covers the continental US only.
  • The app does not know your utility’s current rates — you enter them.

Privacy

What leaves your Mac

There is no account and no analytics. Projects, reports and calculations are stored and run on your Mac.

Sent to outside services

  • An address you search for, or a point you place on the map → Photon (OpenStreetMap).
  • The site’s coordinates → Apple Maps, PVGIS and, when needed, NASA POWER.
  • In the US, the area around the site → USGS, for aerial imagery.

Never sent

  • Your projects, designs and reports.
  • Weather files and photos you import.

Read the full privacy policy